Molecular Graphics and Visualization
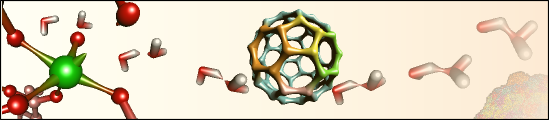
HyperBalls is a new molecular representation based on a unified algorithm for balls, sticks, and hyperboloids. It has its own website comprising some background information, a picture and movie gallery and download links. The HyperBalls implementation is described in more detail in M. Chavent et al., GPU-accelerated atom and dynamic bond visualization using HyperBalls, a unified algorithm for balls, sticks and hyperboloids, Journal of Computational Chemistry (2011),Volume 32, Issue 13, pages 2924â2935, October 2011 (see also HyperBalls paper at Journal website). Ray casting on graphics processing units (GPUs) opens new possibilities for molecular visualization. We describe the implementation and calculation of diverse molecular representations such as licorice, ball-and-stick, space-filling van der Waals spheres, and approximated solvent-accessible surfaces using GPUs. We introduce HyperBalls, an improved ball-and-stick representation replacing tubes, linking the atom spheres by hyperboloids that can smoothly connect them. This type of depiction is particularly useful to represent dynamic phenomena, such as the evolution of noncovalent bonds. It is furthermore well suited to represent coarse-grained models and spring networks. All these representations can be defined by a single general algebraic equation that is adapted for the ray-casting technique and is well suited for execution on the GPU. Using GPU capabilities, this implementation can routinely, accurately, and interactively render molecules ranging from a few atoms up to huge macromolecular assemblies with more than 500,000 particles. In simple cases, based only on spheres, we have been able to display up to two million atoms smoothly.
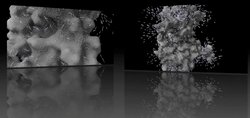
The visualization of field lines of the membrane-inserted BLT2 GPCR is implemented as WebGL-page using SpiderGl. This animation shown on a seperate webpage is supplementary material to the article Electrostatically-driven fast association and perdeuteration allow transferred cross-relaxation detection for G protein-coupled receptor ligands with equilibrium dissociation constants in the high-to-low nanomolar range by Catoire et al., Journal of Biomolecular NMR 2011. Such molecular visualization applications of SpiderGL are described in more detail in M. Callieri et al., Visualization methods for molecular studies on the web platform, The Web3D 2010 Conference, 22-24 July 2010, Los Angeles, California
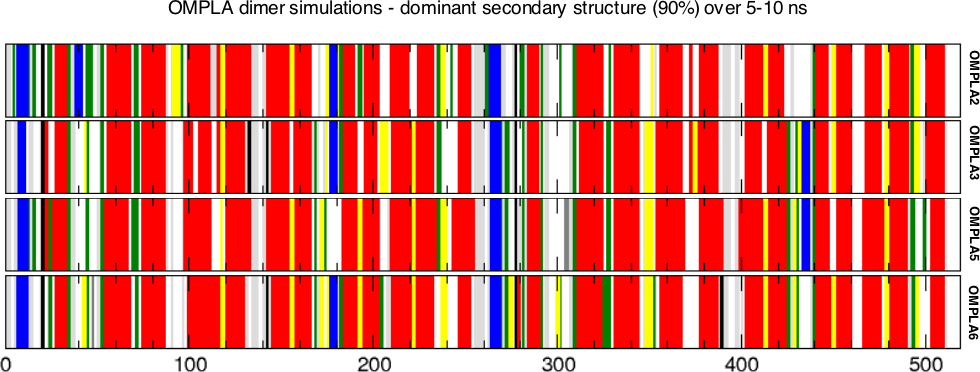
The above figure shows barcharts representing the dominant secondary structure of a protein calculated from the secondary structure time series for a given molecular dynamics simulation. It shows secondary structure elements that are present for at least 90% of the simulation time for the various simulation runs. The dominant secondary structure analysis makes secondary structure comparisons between different simulations easier. This representation was introduced in the recently published computational work on OmpT where we describe molecular dynamics simulations and docking of several tetra-peptides [[Baaden 2004]] and has since been used in a number of computational studies of membrane proteins. The graphs were produced via a script run over the production data of all simulations. The script was specifically developed for this purpose and uses SDF, GNU make, Gromacs, dssp, perl, imagemagick and xmgrace.
| |
|


| $Date: 2011/08/19 12:48:35 $ | Home | LabPage | About... | Send feedback |
| Copyright © 2001-2007 Marc Baaden. | ||
 This work is licensed under a Creative Commons License. | ||